
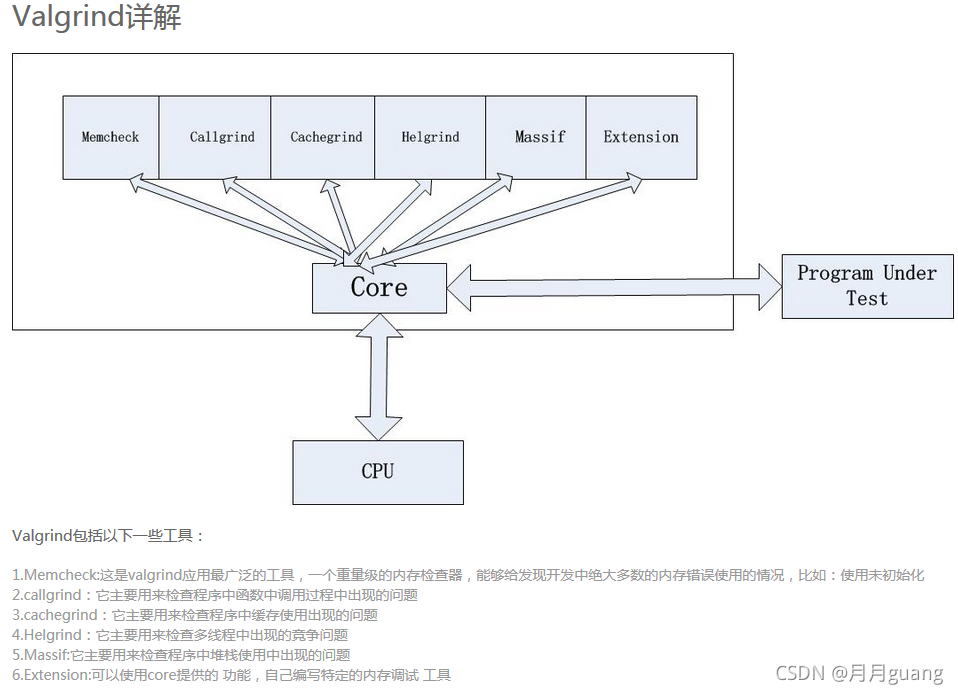
Valgrind是用于構(gòu)建動(dòng)態(tài)分析工具的裝備性框架。它包括一個(gè)工具集,每個(gè)工具執(zhí)行某種類型的調(diào)試、分析或類似的任務(wù),以幫助完善你的程序。Valgrind的架構(gòu)是模塊化的,所以可以容易的創(chuàng)建新的工具而又不會(huì)擾亂現(xiàn)有的結(jié)構(gòu)。
典型情況下,Valgrind會(huì)提供如下一系列的有用工具:
Memcheck 是一個(gè)內(nèi)存錯(cuò)誤偵測(cè)器。它有助于使你的程序,尤其是那些采用C或C 來寫的程序,更加準(zhǔn)確;
Cachegrind 是一個(gè)緩存和分支預(yù)測(cè)分析器。其有助于你提高程序的運(yùn)行性能;
Callgrind 是一個(gè)調(diào)用圖緩存生成分析器。它與Cachegrind的功能有重疊,但是也收集Cachegrind不收集的一些信息;
Helgrind 是一個(gè)線程錯(cuò)誤檢測(cè)器。它有助于使你的多線程程序更加準(zhǔn)確;
DRD 也是一個(gè)線程錯(cuò)誤檢測(cè)器。它和Helgrind相似,但使用不同的分析技術(shù),所以可能找到不同的問題;
Massif 是一個(gè)堆分析器。它有助于使你的程序使用更少的內(nèi)存;
DHAT 是另一種不同的堆分析器。它有助于理解塊(block)的生命周期、塊的使用和布局的低效等問題;
SGcheck 是一個(gè)仍處于試驗(yàn)狀態(tài)的工具,用來檢測(cè)堆和全局?jǐn)?shù)組的溢出。它的功能和Memcheck互補(bǔ):SGcheck能找到一些Memcheck無法找到的問題,反之亦然;
BBV 是一個(gè)仍處于試驗(yàn)狀態(tài)的SimPoint基本款矢量生成器。它對(duì)于進(jìn)行計(jì)算機(jī)架構(gòu)的研究和開發(fā)很有用處。
另外,也有一些大多數(shù)用戶不會(huì)用到的小工具: Lackey是一個(gè)示例工具,用于演示一些裝備的基礎(chǔ)性內(nèi)容;Nulgrind是一個(gè)最小化的Valgrind工具,不做分析或者操作,僅用于測(cè)試目的。
1) Memcheck
最常用的工具,用來檢測(cè)程序中出現(xiàn)的內(nèi)存問題,所有對(duì)內(nèi)存的讀寫都會(huì)被檢測(cè)到,一切對(duì)malloc、free、new、delete的調(diào)用都會(huì)被捕獲。所以,它能檢測(cè)以下問題:
1. 對(duì)未初始化內(nèi)存的使用;
2. 讀/寫釋放后的內(nèi)存塊;
3. 讀/寫超出malloc分配的內(nèi)存塊;
4. 讀/寫不適當(dāng)?shù)臈V袃?nèi)存塊;
5. 內(nèi)存泄露,指向一塊內(nèi)存的指針永遠(yuǎn)丟失;
6. 不正確的malloc/free或者new/delete匹配;
7. memcpy()相關(guān)函數(shù)中的dst和src指針重疊;
這些問題往往是C/C 程序員最頭疼的問題,Memcheck能在這里幫上大忙。
2) Callgrind
和gprof類似的分析工具,但它對(duì)程序的運(yùn)行觀察更為入微,能給我們提供更多的信息。和gprof不同的是,它不需要在編譯源代碼時(shí)附加特殊選項(xiàng),但還是推薦加上調(diào)試選項(xiàng)。Callgrind收集程序運(yùn)行時(shí)的一些數(shù)據(jù),建立函數(shù)調(diào)用關(guān)系圖,還可以有選擇地進(jìn)行cache模擬。在運(yùn)行結(jié)束時(shí),它會(huì)把分析數(shù)據(jù)寫入一個(gè)文件。callgrind_annotate可以把這個(gè)文件的內(nèi)容轉(zhuǎn)化成可讀的形式。
3) Cachegrind
Cache分析器,它模擬CPU中的一級(jí)緩存和二級(jí)緩存,能夠精確地指出程序中cache的丟失和命中。如果需要,它還能夠?yàn)槲覀兲峁ヽache丟失次數(shù),內(nèi)存引用次數(shù),以及每行代碼,每個(gè)函數(shù),每個(gè)模塊,整個(gè)程序產(chǎn)生的指令數(shù)。這對(duì)優(yōu)化程序有很大的幫助。
做一下廣告:valgrind自身利用該工具在過去幾個(gè)月使性能提高了25%~30%。據(jù)早先報(bào)道, kde的開發(fā)team也對(duì)valgrind在提高kde性能方面的幫助表示感謝。
4) Helgrind
它主要用來檢查多線程程序中出現(xiàn)的競(jìng)爭(zhēng)問題。Helgrind尋找內(nèi)存中被多個(gè)線程訪問,而又沒有一貫加鎖的區(qū)域,這些區(qū)域往往是線程之間失去同步的地方,而且會(huì)導(dǎo)致難以發(fā)覺的錯(cuò)誤。Helgrind實(shí)現(xiàn)了名為Eraser的競(jìng)爭(zhēng)檢測(cè)算法,并做了進(jìn)一步改進(jìn),減少了報(bào)告錯(cuò)誤的次數(shù)。不過,Helgrind仍然處于實(shí)驗(yàn)狀態(tài)。
5) Massif
堆棧分析器,它能測(cè)量程序在堆棧中使用了多少內(nèi)存,告訴我們堆塊,堆管理塊和棧的大小。Massif能幫助我們減少內(nèi)存的使用,在帶有虛擬內(nèi)存的現(xiàn)代系統(tǒng)中,它還能夠加速我們程序的運(yùn)行,減少程序停留在交換區(qū)中的幾率。
Massif對(duì)內(nèi)存的分配和釋放做profile。程序開發(fā)者通過它可以深入了解程序的內(nèi)存使用行為,從而對(duì)內(nèi)存使用進(jìn)行優(yōu)化。這個(gè)功能對(duì)C 尤其有用,因?yàn)镃 有很多隱藏的內(nèi)存分配和釋放。
# yum search valgrind Loaded plugins: fastestmirror, langpacks Loading mirror speeds from cached hostfile * base: mirrors.aliyun.com * extras: mirrors.aliyun.com * updates: mirrors.aliyun.com ==================== N/S matched: valgrind ======================================== valgrind-devel.i686 : Development files for valgrind valgrind-devel.x86_64 : Development files for valgrind valgrind-openmpi.x86_64 : OpenMPI support for valgrind valgrind.i686 : Tool for finding memory management bugs in programs valgrind.x86_64 : Tool for finding memory management bugs in programs Name and summary matches only, use "search all" for everything. # yum install valgrind
安裝所需依賴
# yum install autoconf # yum install automake
下載安裝包(官網(wǎng)下載地址)
# mkdir valgrind-inst
# cd valgrind-intst/
# wget http://www.valgrind.org/downloads/valgrind-3.14.0.tar.bz2
# ls
valgrind-3.14.0.tar.bz2
安裝valgrind
# tar -jxvf valgrind-3.14.0.tar.bz2 # cd valgrind-3.14.0 # ./autogen.sh running: aclocal running: autoheader running: automake -a running: autoconf # ./configure # make # make install # valgrind --version valgrind-3.14.0 # which valgrind /usr/local/bin/valgrind
valgrind的基本使用格式如下:
valgrind [options] prog-and-args
其支持眾多選項(xiàng),我們可以通過valgrind --help來進(jìn)行查看。這里我們只介紹幾個(gè)較為常用的選項(xiàng):
[options]
常用選項(xiàng),適用于所有Valgrind工具
--tool=<name> 是最常用的選項(xiàng),用于選擇使用valgrind工具集中的哪一個(gè)工具,默認(rèn)值為memcheck;
-v/--version 顯示valgrind內(nèi)核的版本,每個(gè)工具都有各自的版本;
-h/–help 顯示幫助信息;
-q --quiet 安靜的運(yùn)行,只打印錯(cuò)誤消息;
-v -–verbose 打印更詳細(xì)的信息
--trace-children=no|yes 是否跟蹤子進(jìn)程,默認(rèn)值為no;
--track-fds=no|yes 是否追蹤打開的文件描述符,默認(rèn)為no;
--time-stamp=no|yes 是否在打印出的每條消息之前加上時(shí)間戳信息,默認(rèn)值為no
--log-fd=<number> 輸出LOG到描述符文件 [2=stderr]
--log-file=<file> 指定將消息打印到某個(gè)文件
--log-file-exactly=<file> 輸出LOG信息到 file
--log-file-qualifier=<VAR> 取得環(huán)境變量的值來做為輸出信息的文件名,[none]
--log-socket=ipaddr:port 輸出LOG到socket,ipaddr:port
LOG信息輸出
--xml=yes 將信息以xml格式輸出,只有memcheck可用
--num-callers=<number> show <number> callers in stack traces [12]
--error-limit=no|yes 如果太多錯(cuò)誤,則停止顯示新錯(cuò)誤? [yes]
--error-exitcode=<number> 如果發(fā)現(xiàn)錯(cuò)誤則返回錯(cuò)誤代碼 [0=disable]
--db-attach=no|yes 當(dāng)出現(xiàn)錯(cuò)誤,valgrind會(huì)自動(dòng)啟動(dòng)調(diào)試器gdb。[no]
--db-command=<command> 啟動(dòng)調(diào)試器的命令行選項(xiàng)[gdb -nw %f %p]
適用于Memcheck工具的相關(guān)選項(xiàng):
--leak-check=no|summary|full 在退出時(shí)是否查找內(nèi)存泄露。默認(rèn)值為summary
--leak-resolution=low|med|high how much bt merging in leak check [low]
--show-reachable=no|yes show reachable blocks in leak check? [no]
最常用的命令格式:
valgrind --tool=memcheck --leak-check=full ./test
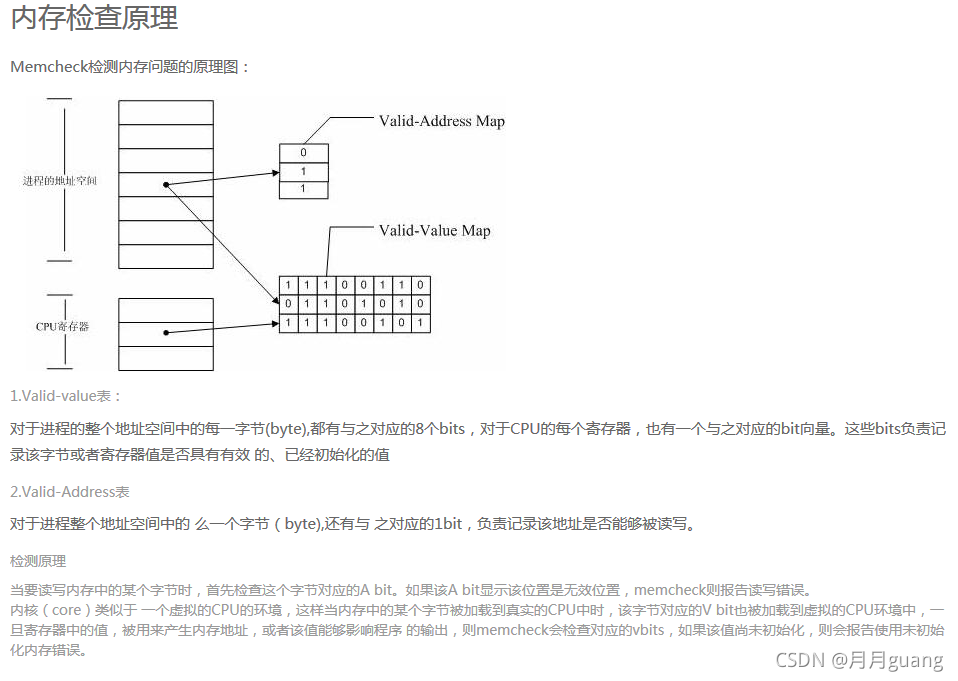
這里我們主要講述一下valgrind中memcheck工具的使用。該工具可以檢測(cè)下列與內(nèi)存相關(guān)的問題:
未初始化內(nèi)存的使用;
對(duì)釋放后內(nèi)存的讀/寫;
對(duì)已分配內(nèi)存塊尾部的讀/寫;
內(nèi)存泄露;
不匹配的使用malloc/free、new/delete、new[]/delete[]
重復(fù)釋放內(nèi)存
上面列出的并不是很全面,但卻包含了能被該工具檢測(cè)到的很多普遍問題。下面我們會(huì)一個(gè)個(gè)的對(duì)上面的場(chǎng)景進(jìn)行討論。
注意:下面討論的所有測(cè)試代碼在編譯時(shí)最好都加上-g選項(xiàng)(用來在memcheck的輸出中生成行號(hào))進(jìn)行編譯。
1) 示例程序
#include <stdio.h>
#include <stdlib.h>

int main(void)
{
    char *p;

    char c = *p;

    printf("\n [%c]\n",c);

    return 0;
}
在上面的代碼中,我們嘗試使用未初始化的指針p。
2) 調(diào)試技巧
如下我們運(yùn)行Memcheck來看下結(jié)果:
# gcc -g -c -o test.o test.c
# gcc -o test test.o

# valgrind --tool=memcheck ./test
==5918== Memcheck, a memory error detector
==5918== Copyright (C) 2002-2017, and GNU GPL'd, by Julian Seward et al.
==5918== Using Valgrind-3.14.0 and LibVEX; rerun with -h for copyright info
==5918== Command: ./test
==5918==
==5918== Use of uninitialised value of size 8
==5918==    at 0x400539: main (test.c:8)
==5918==
==5918== Invalid read of size 1
==5918==    at 0x400539: main (test.c:8)
==5918==  Address 0x0 is not stack'd, malloc'd or (recently) free'd
==5918==
==5918==
==5918== Process terminating with default action of signal 11 (SIGSEGV)
==5918==  Access not within mapped region at address 0x0
==5918==    at 0x400539: main (test.c:8)
==5918==  If you believe this happened as a result of a stack
==5918==  overflow in your program's main thread (unlikely but
==5918==  possible), you can try to increase the size of the
==5918==  main thread stack using the --main-stacksize= flag.
==5918==  The main thread stack size used in this run was 8388608.
==5918==
==5918== HEAP SUMMARY:
==5918==     in use at exit: 0 bytes in 0 blocks
==5918==   total heap usage: 0 allocs, 0 frees, 0 bytes allocated
==5918==
==5918== All heap blocks were freed -- no leaks are possible
==5918==
==5918== For counts of detected and suppressed errors, rerun with: -v
==5918== Use --track-origins=yes to see where uninitialised values come from
==5918== ERROR SUMMARY: 2 errors from 2 contexts (suppressed: 0 from 0)
Segmentation fault (core dumped)
從上面的輸出可以看到,valgrind檢測(cè)到了未初始化的變量,然后給出了警告。
1) 示例程序
#include <stdio.h>
#include <stdlib.h>

int main(void)
{
    char *p = malloc(1);
    *p = 'a';

    char c = *p;

    printf("\n [%c]\n",c);

    free(p);
    c = *p;
    return 0;
}上面的代碼中,我們有一個(gè)釋放了內(nèi)存的指針p,然后我們又嘗試?yán)弥羔槴@取值。
2) 調(diào)試技巧
如下我們運(yùn)行memcheck來看一下Valgrind對(duì)這種情況是如何反應(yīng)的:
# gcc -g -c -o test.o test.c
# gcc -o test test.o

# valgrind --tool=memcheck ./test
==6067== Memcheck, a memory error detector
==6067== Copyright (C) 2002-2017, and GNU GPL'd, by Julian Seward et al.
==6067== Using Valgrind-3.14.0 and LibVEX; rerun with -h for copyright info
==6067== Command: ./test
==6067==

 [a]
==6067== Invalid read of size 1
==6067==    at 0x400609: main (test.c:14)
==6067==  Address 0x51f6040 is 0 bytes inside a block of size 1 free'd
==6067==    at 0x4C28F7D: free (vg_replace_malloc.c:530)
==6067==    by 0x400604: main (test.c:13)
==6067==  Block was alloc'd at
==6067==    at 0x4C27E83: malloc (vg_replace_malloc.c:299)
==6067==    by 0x4005CE: main (test.c:6)
==6067==
==6067==
==6067== HEAP SUMMARY:
==6067==     in use at exit: 0 bytes in 0 blocks
==6067==   total heap usage: 1 allocs, 1 frees, 1 bytes allocated
==6067==
==6067== All heap blocks were freed -- no leaks are possible
==6067==
==6067== For counts of detected and suppressed errors, rerun with: -v
==6067== ERROR SUMMARY: 1 errors from 1 contexts (suppressed: 0 from 0)
從上面的輸出內(nèi)容可以看到,valgrind檢測(cè)到了無效的讀取操作,然后輸出了警告 ‘Invalid read of size 1’。
1) 示例程序
#include <stdio.h>
#include <stdlib.h>

int main(void)
{
    char *p = malloc(1);
    *p = 'a';

    char c = *(p 1);

    printf("\n [%c]\n",c);

    free(p);
    return 0;
}
在上面的代碼中,我們已經(jīng)為p分配了一個(gè)字節(jié)的內(nèi)存,但我們?cè)趯⒅底x取到c中的時(shí)候使用的地址是p 1。
2) 調(diào)試技巧
現(xiàn)在我們使用Valgrind運(yùn)行上面的代碼:
# gcc -g -c -o test.o test.c
# gcc -o test test.o

# valgrind --tool=memcheck ./test
==6302== Memcheck, a memory error detector
==6302== Copyright (C) 2002-2017, and GNU GPL'd, by Julian Seward et al.
==6302== Using Valgrind-3.14.0 and LibVEX; rerun with -h for copyright info
==6302== Command: ./test
==6302==
==6302== Invalid read of size 1
==6302==    at 0x4005DE: main (test.c:9)
==6302==  Address 0x51f6041 is 0 bytes after a block of size 1 alloc'd
==6302==    at 0x4C27E83: malloc (vg_replace_malloc.c:299)
==6302==    by 0x4005CE: main (test.c:6)
==6302==

 []
==6302==
==6302== HEAP SUMMARY:
==6302==     in use at exit: 0 bytes in 0 blocks
==6302==   total heap usage: 1 allocs, 1 frees, 1 bytes allocated
==6302==
==6302== All heap blocks were freed -- no leaks are possible
==6302==
==6302== For counts of detected and suppressed errors, rerun with: -v
==6302== ERROR SUMMARY: 1 errors from 1 contexts (suppressed: 0 from 0)
同樣,該工具在這種情況下也檢測(cè)到了無效的讀取操作。
1) 示例程序
#include <stdio.h>
#include <stdlib.h>

int main(void)
{
    char *p = malloc(1);
    *p = 'a';

    char c = *p;

    printf("\n [%c]\n",c);

    return 0;
}
在這次的代碼中,我們申請(qǐng)了一個(gè)字節(jié)但是沒有將它釋放。現(xiàn)在讓我們運(yùn)行valgrind看看會(huì)發(fā)生什么。
2) 調(diào)試技巧
# valgrind --tool=memcheck ./test
==6376== Memcheck, a memory error detector
==6376== Copyright (C) 2002-2017, and GNU GPL'd, by Julian Seward et al.
==6376== Using Valgrind-3.14.0 and LibVEX; rerun with -h for copyright info
==6376== Command: ./test
==6376==

 [a]
==6376==
==6376== HEAP SUMMARY:
==6376==     in use at exit: 1 bytes in 1 blocks
==6376==   total heap usage: 1 allocs, 0 frees, 1 bytes allocated
==6376==
==6376== LEAK SUMMARY:
==6376==    definitely lost: 1 bytes in 1 blocks
==6376==    indirectly lost: 0 bytes in 0 blocks
==6376==      possibly lost: 0 bytes in 0 blocks
==6376==    still reachable: 0 bytes in 0 blocks
==6376==         suppressed: 0 bytes in 0 blocks
==6376== Rerun with --leak-check=full to see details of leaked memory
==6376==
==6376== For counts of detected and suppressed errors, rerun with: -v
==6376== ERROR SUMMARY: 0 errors from 0 contexts (suppressed: 0 from 0)
上面顯示檢測(cè)到了內(nèi)存泄露。這里如果我們加上一個(gè)--leak-check=full選項(xiàng)的話,則可以看到更為詳細(xì)的細(xì)節(jié)。
上面LEAK SUMMARY會(huì)打印5種不同的類型,這里我們簡(jiǎn)單介紹一下:
definitely lost: 明確丟失的內(nèi)存。程序中存在內(nèi)存泄露,應(yīng)盡快修復(fù)。當(dāng)程序結(jié)束時(shí)如果一塊動(dòng)態(tài)分配的內(nèi)存沒有被釋放并且通過程序內(nèi)的指針變量均無法訪問這塊內(nèi)存則會(huì)報(bào)這個(gè)錯(cuò)誤;
indirectly lost: 間接丟失。當(dāng)使用了含有指針成員的類或結(jié)構(gòu)體時(shí)可能會(huì)報(bào)這個(gè)錯(cuò)誤。這類錯(cuò)誤無需直接修復(fù),它們總是與definitely lost一起出現(xiàn),只要修復(fù)definitely lost即可。
possibly lost: 可能丟失。大多數(shù)情況下應(yīng)視為與definitely lost一樣需要盡快修復(fù),除非你的程序讓一個(gè)指針指向一塊動(dòng)態(tài)分配的內(nèi)存(但不是這塊內(nèi)存的起始地址),然后通過運(yùn)算得到這塊內(nèi)存的起始地址,再釋放它。當(dāng)程序結(jié)束時(shí)如果一塊動(dòng)態(tài)分配的內(nèi)存沒有被釋放并且通過程序內(nèi)的指針變量均無法訪問這塊內(nèi)存的起始地址,但可以訪問其中的某一部分?jǐn)?shù)據(jù),則會(huì)報(bào)這個(gè)錯(cuò)誤。
stil reachable: 可以訪問,未丟失但也未釋放。如果程序是正常結(jié)束的,那么它可能不會(huì)造成程序崩潰,但長時(shí)間運(yùn)行有可能耗盡系統(tǒng)資源。
1) 示例代碼
#include <stdio.h>
#include <stdlib.h>
#include<iostream>

int main(int argc, char *argv[])
{
    char *p = (char *)malloc(1);
    *p = 'a';

    char c = *p;

    printf("\n [%c]\n", c);

    delete p;

    return 0x0;
}
上面的代碼中,我們使用了malloc()來分配內(nèi)存,但是使用了delete操作符來刪除內(nèi)存。
2) 調(diào)試技巧
# gcc -g -c -o test.o test.cpp
# gcc -o test test.o -lstdc

# valgrind --tool=memcheck ./test
==15237== Memcheck, a memory error detector
==15237== Copyright (C) 2002-2017, and GNU GPL'd, by Julian Seward et al.
==15237== Using Valgrind-3.14.0 and LibVEX; rerun with -h for copyright info
==15237== Command: ./test
==15237==

 [a]
==15237== Mismatched free() / delete / delete []
==15237==    at 0x4C2942D: operator delete(void*) (vg_replace_malloc.c:576)
==15237==    by 0x4007EB: main (test.cpp:14)
==15237==  Address 0x5a15040 is 0 bytes inside a block of size 1 alloc'd
==15237==    at 0x4C27E83: malloc (vg_replace_malloc.c:299)
==15237==    by 0x4007B5: main (test.cpp:7)
==15237==
==15237==
==15237== HEAP SUMMARY:
==15237==     in use at exit: 0 bytes in 0 blocks
==15237==   total heap usage: 1 allocs, 1 frees, 1 bytes allocated
==15237==
==15237== All heap blocks were freed -- no leaks are possible
==15237==
==15237== For counts of detected and suppressed errors, rerun with: -v
==15237== ERROR SUMMARY: 1 errors from 1 contexts (suppressed: 0 from 0)
從上面的輸出可以看到,valgrind清楚的說明了 ‘Mismatched free() / delete / delete[] ‘
1) 代碼示例
#include <stdio.h>
#include <stdlib.h>

int main(int argc, char *argv[])
{
    char *p = (char *)malloc(1);
    *p = 'a';

    char c = *p;
    printf("\n [%c]\n",c);
    free(p);
    free(p);
    return 0;
}
2) 調(diào)試技巧
在上面的代碼中,我們兩次釋放了p指向的內(nèi)存,現(xiàn)在讓我們運(yùn)行memcheck:
# gcc -g -c -o test.o test.c
# gcc -o test test.o

# valgrind --tool=memcheck ./test
==15354== Memcheck, a memory error detector
==15354== Copyright (C) 2002-2017, and GNU GPL'd, by Julian Seward et al.
==15354== Using Valgrind-3.14.0 and LibVEX; rerun with -h for copyright info
==15354== Command: ./test
==15354==

 [a]
==15354== Invalid free() / delete / delete[] / realloc()
==15354==    at 0x4C28F7D: free (vg_replace_malloc.c:530)
==15354==    by 0x400617: main (test.c:12)
==15354==  Address 0x51f6040 is 0 bytes inside a block of size 1 free'd
==15354==    at 0x4C28F7D: free (vg_replace_malloc.c:530)
==15354==    by 0x40060B: main (test.c:11)
==15354==  Block was alloc'd at
==15354==    at 0x4C27E83: malloc (vg_replace_malloc.c:299)
==15354==    by 0x4005D5: main (test.c:6)
==15354==
==15354==
==15354== HEAP SUMMARY:
==15354==     in use at exit: 0 bytes in 0 blocks
==15354==   total heap usage: 1 allocs, 2 frees, 1 bytes allocated
==15354==
==15354== All heap blocks were freed -- no leaks are possible
==15354==
==15354== For counts of detected and suppressed errors, rerun with: -v
==15354== ERROR SUMMARY: 1 errors from 1 contexts (suppressed: 0 from 0)
從上面的輸出可以看到,該功能檢測(cè)到我們對(duì)同一個(gè)指針調(diào)用了兩次釋放內(nèi)存操作。
1) 示例程序
#include <stdio.h>
#include <stdlib.h>

class c1
{
private:
    char *m_pcData;


public:
    c1();
    ~c1();
};


c1::c1()
{
    m_pcData=(char*)malloc(10);
}


c1::~c1()
{
    if(m_pcData) delete m_pcData;
}

char *Fun1()//definitely lost
{
    char *pcTemp;


    pcTemp=(char*)malloc(10);
    return pcTemp;
}


char *Fun2()//still reachable
{
    static char *s_pcTemp=NULL;


    if(s_pcTemp==NULL) s_pcTemp=(char*)malloc(10);


    return NULL;
}


char *Fun3()//possibly lost
{
    static char *s_pcTemp;
    char *pcData;


    pcData=(char*)malloc(10);
    s_pcTemp=pcData 1;


    return NULL;
}


int Fun4()//definitely and indirectly lost
{
    c1 *pobjTest;


    pobjTest=new c1();


    return 0;
}


char *Fun5()//possibly lost but no need of repair,repair the breakdown then no memory leak
{
    char *pcData;
    int i,*piTemp=NULL;


    pcData=(char*)malloc(10);
    pcData =10;
    for(i=0;i<10;i  )
    {
        pcData--;
        *pcData=0;

        if(i==5) *piTemp=1;//create a breakdown
    }
    free(pcData);


    return NULL;
}


int main(int argc, char *argv[])
{
    printf("This program will create various memory leak,use valgrind to observe it.\n");
    printf("Following functions are bad codes,don\'t imitate.\n");
    printf("Fun1\n");
    Fun1();
    printf("Fun2\n");
    Fun2();
    printf("Fun3\n");
    Fun3();
    printf("Fun4\n");
    Fun4();
    printf("Fun5\n");
    Fun5();
    printf("end\n");


    return 0;
}
2) 調(diào)試技巧
# gcc -g -c -o test.o test.cpp
# gcc -o test test.o -lstdc
# valgrind --tool=memcheck ./test
==15596== Memcheck, a memory error detector
==15596== Copyright (C) 2002-2017, and GNU GPL'd, by Julian Seward et al.
==15596== Using Valgrind-3.14.0 and LibVEX; rerun with -h for copyright info
==15596== Command: ./test
==15596==
This program will create various memory leak,use valgrind to observe it.
Following functions are bad codes,don't imitate.
Fun1
Fun2
Fun3
Fun4
Fun5
==15596== Invalid write of size 4
==15596==    at 0x400859: Fun5() (test.cpp:88)
==15596==    by 0x4008E9: main (test.cpp:110)
==15596==  Address 0x0 is not stack'd, malloc'd or (recently) free'd
==15596==
==15596==
==15596== Process terminating with default action of signal 11 (SIGSEGV)
==15596==  Access not within mapped region at address 0x0
==15596==    at 0x400859: Fun5() (test.cpp:88)
==15596==    by 0x4008E9: main (test.cpp:110)
==15596==  If you believe this happened as a result of a stack
==15596==  overflow in your program's main thread (unlikely but
==15596==  possible), you can try to increase the size of the
==15596==  main thread stack using the --main-stacksize= flag.
==15596==  The main thread stack size used in this run was 8388608.
==15596==
==15596== HEAP SUMMARY:
==15596==     in use at exit: 58 bytes in 6 blocks
==15596==   total heap usage: 6 allocs, 0 frees, 58 bytes allocated
==15596==
==15596== LEAK SUMMARY:
==15596==    definitely lost: 18 bytes in 2 blocks
==15596==    indirectly lost: 10 bytes in 1 blocks
==15596==      possibly lost: 20 bytes in 2 blocks
==15596==    still reachable: 10 bytes in 1 blocks
==15596==         suppressed: 0 bytes in 0 blocks
==15596== Rerun with --leak-check=full to see details of leaked memory
==15596==
==15596== For counts of detected and suppressed errors, rerun with: -v
==15596== ERROR SUMMARY: 1 errors from 1 contexts (suppressed: 0 from 0)
Segmentation fault (core dumped)
[參看]
參考網(wǎng)站:
http://www.linuxidc.com/Linux/2012-06/63754.htm
http://elinux.org/Valgrind (wiki)
http://blog.csdn.net/sduliulun/article/details/7732906
http://blog.csdn.net/gatieme/article/details/51959654(比較全面的介紹)
http://www.linuxidc.com/Linux/2012-06/63754.htm (非常詳細(xì)的介紹了每個(gè)工具的使用)


