
本人分享基于VSCode+OpenOCD進行RISCV的硬件仿真調試。這里的環境是Winodws下運行OpenOCD,WSL中運行GDB連接OpenOCD。
Terminal->Configure Tasks...
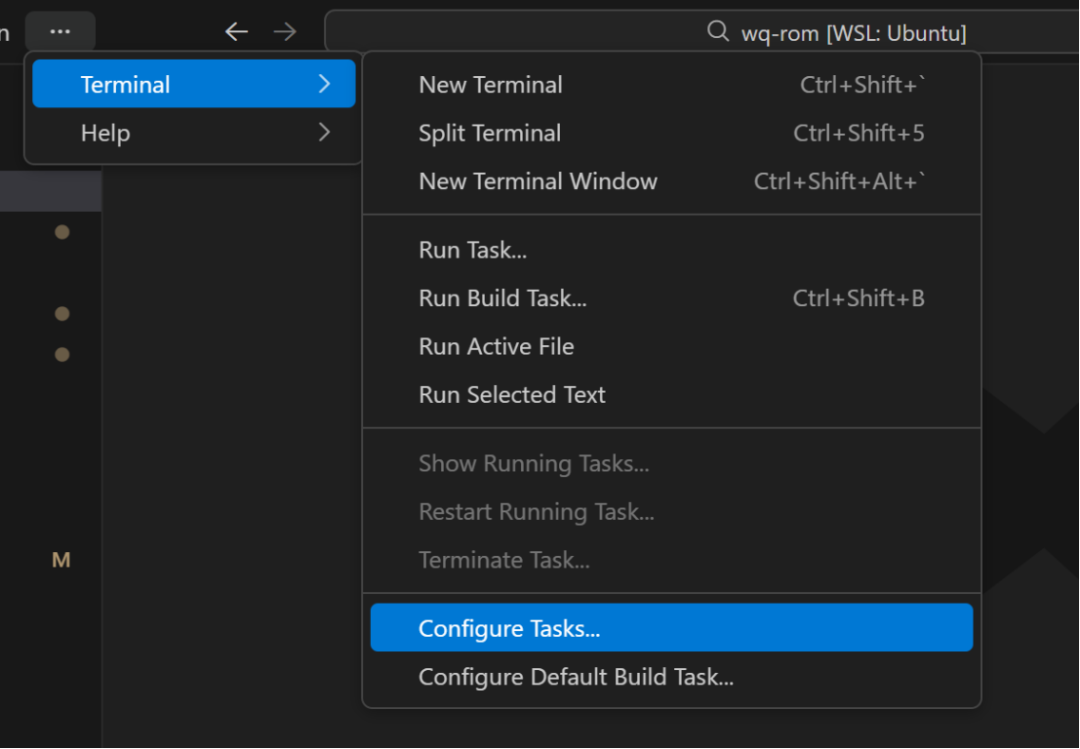
選擇Create tasks.json file from template
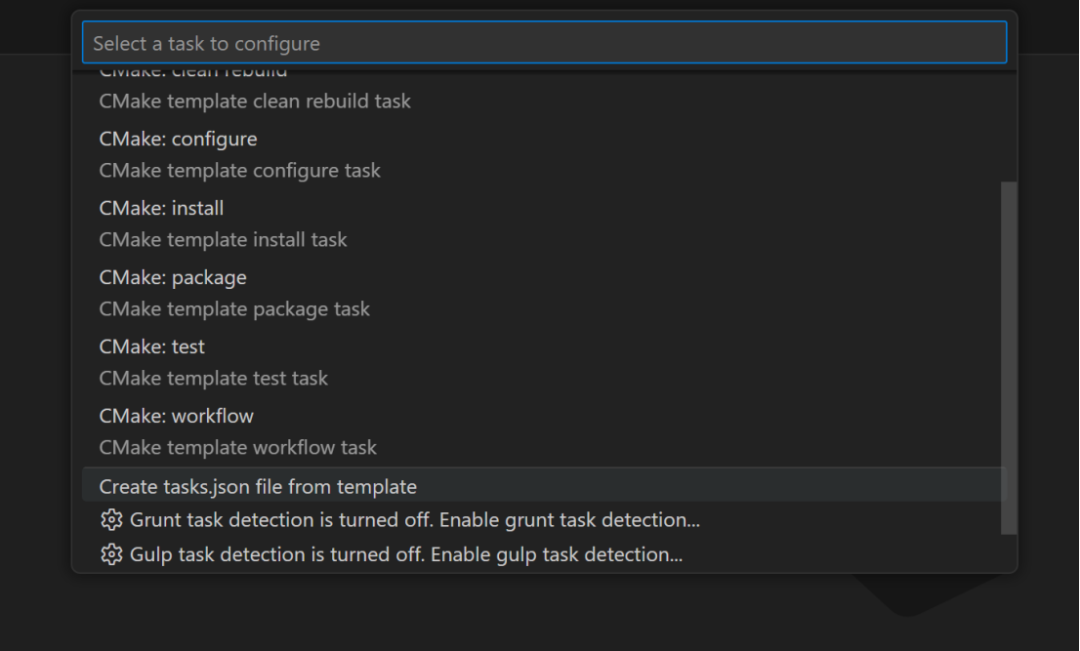
選others
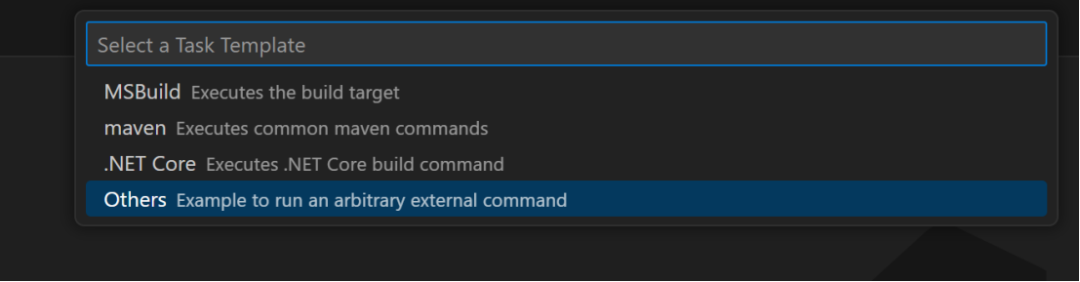
修改以下內容
lable為要顯示的菜單名字
Command為要執行的命令,多條命令用分號隔開
這里需要注意命令的當前目錄是.vscode文件夾所在的目錄
{// See https://go.microsoft.com/fwlink/?LinkId=733558// for the documentation about the tasks.json format"version": "2.0.0","tasks": [{"label": "編譯","type": "shell","command": "替換要執行的編譯命令","problemMatcher": ["$gcc"]}]}
執行
Terminal->Run Task...
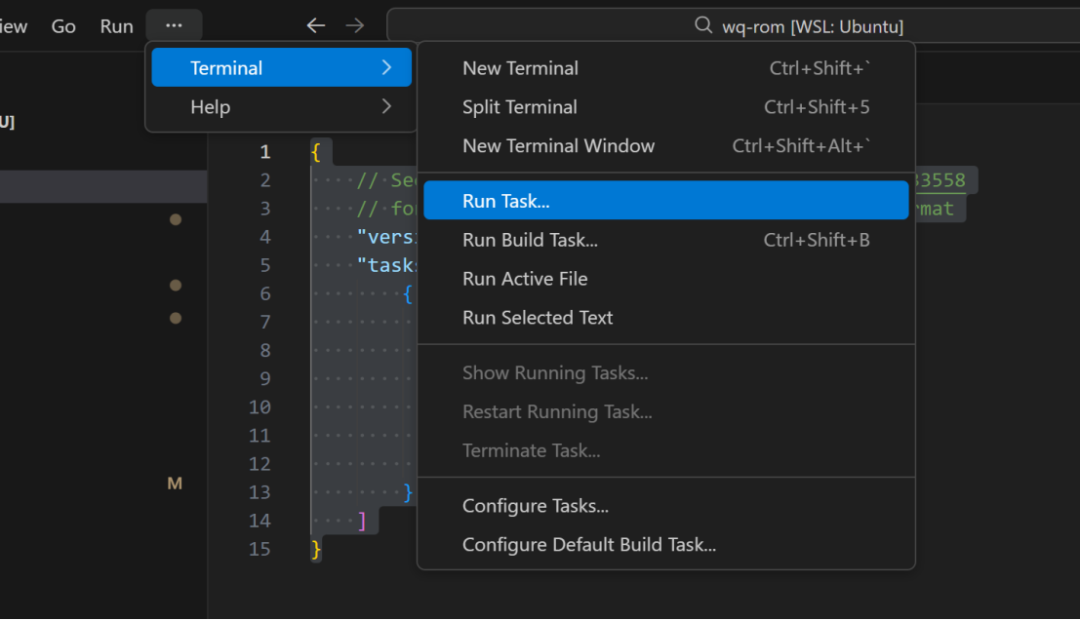
點擊編譯(即前面設置的label),即可執行用戶自定義的編譯命令。
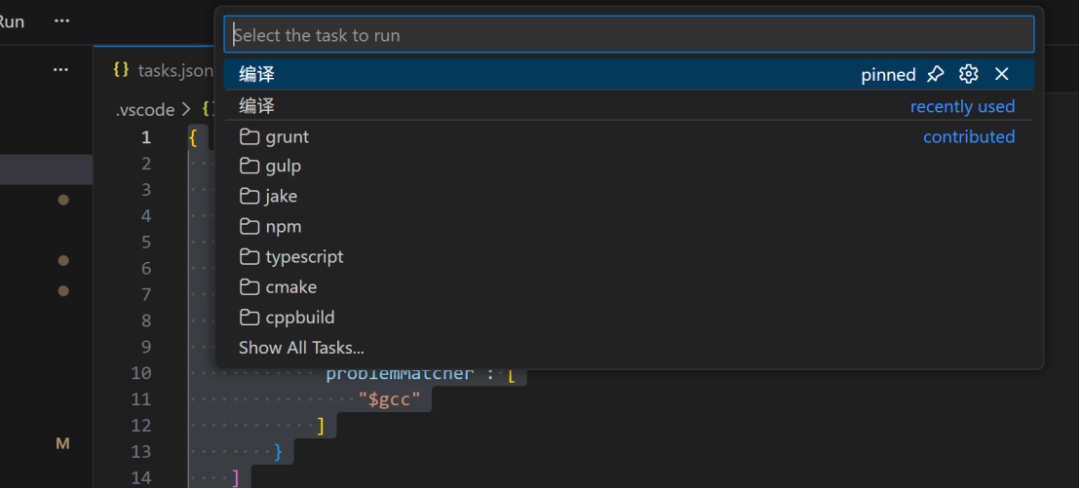
還可以加一個清除功能
{// See https://go.microsoft.com/fwlink/?LinkId=733558// for the documentation about the tasks.json format"version": "2.0.0","tasks": [{"label": "編譯","type": "shell","command": "替換要執行的編譯命令","problemMatcher": ["$gcc"]},{"label": "清除","type": "shell","command": "替換要執行的清除命令","problemMatcher": ["$gcc"]}]}
此時可以看到增加的清除菜單
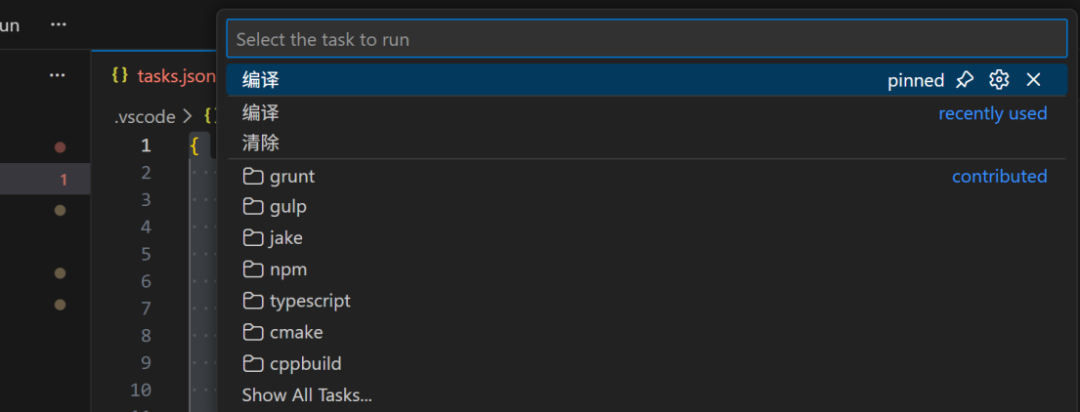
我這里使用Windows下OpenOCD+WSL下GDB
按照如下創建launch.json
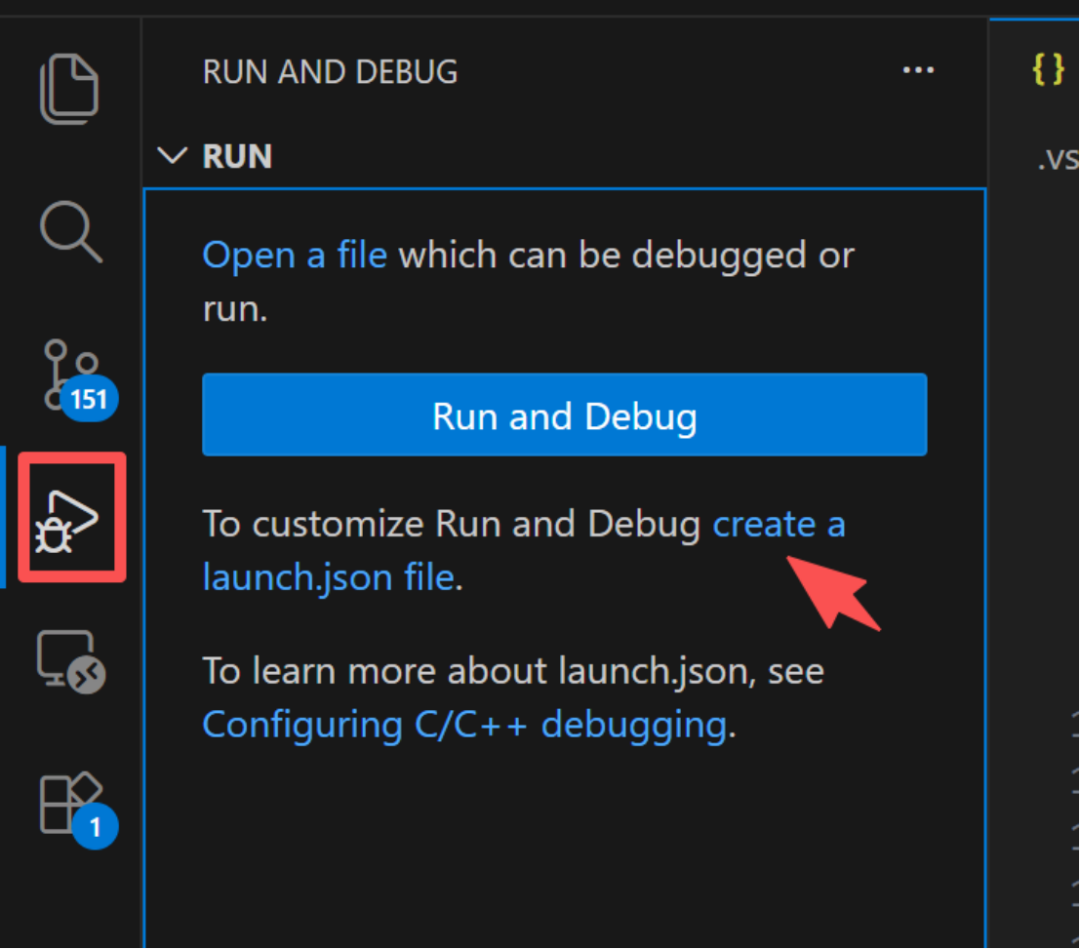
選擇C++(GDB/LLDB)
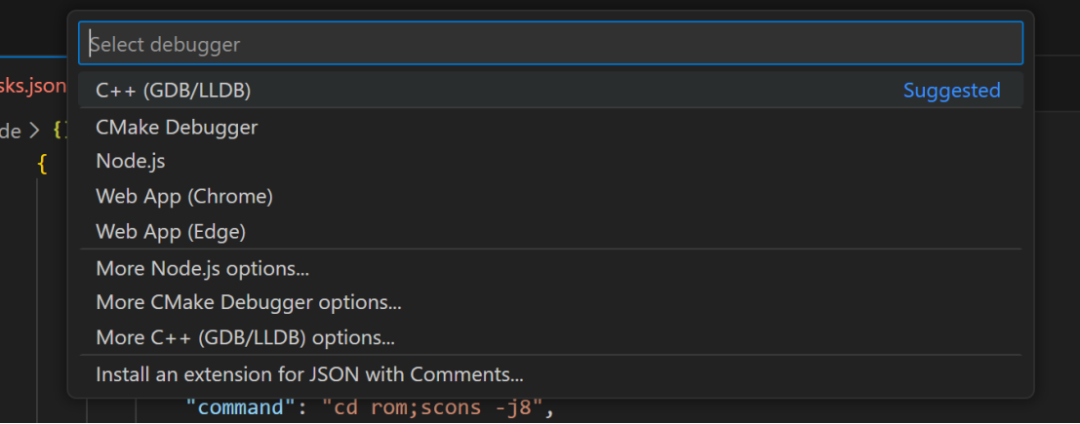
選擇{}C/C++: (gdb) launch
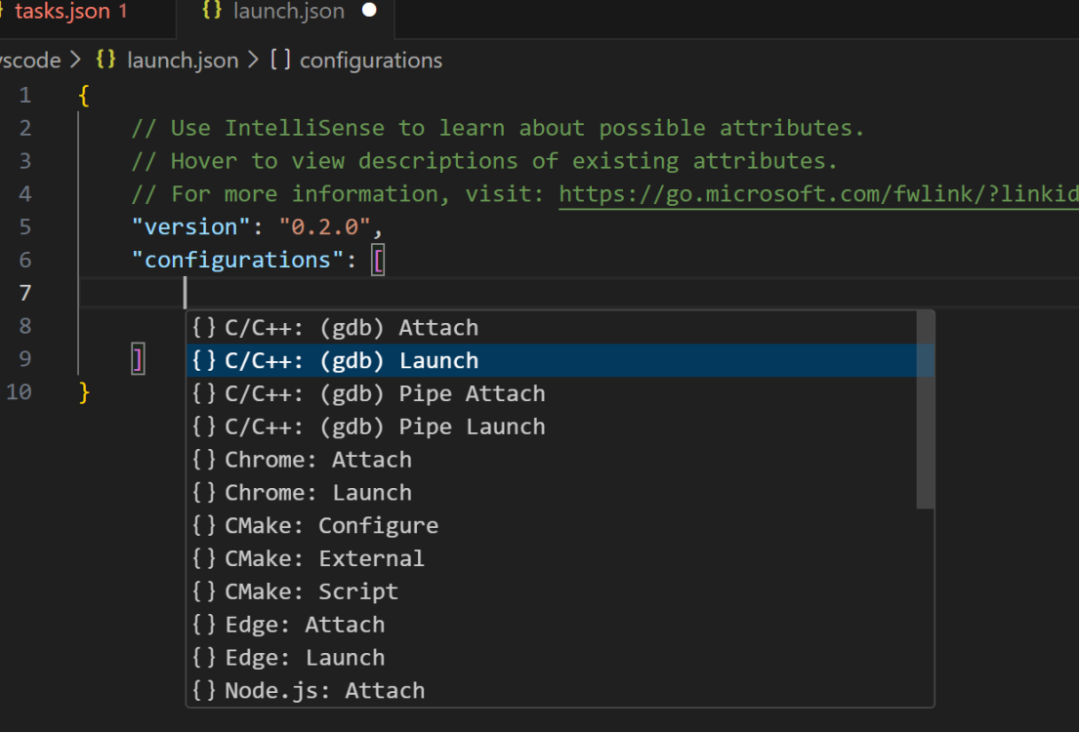
生成模板
按照模板修改
修改內容如下
{// Use IntelliSense to learn about possible attributes.// Hover to view descriptions of existing attributes.// For more information, visit: https://go.microsoft.com/fwlink/?linkid=830387"version": "0.2.0","configurations": [{"name": "仿真","type":"cppdbg","request": "launch","program": "${workspaceFolder}/xxxx.elf","args": [],"cwd": "${workspaceFolder}","stopAtEntry": true,"environment": [],"externalConsole": true,"MIMode": "gdb","miDebuggerPath": "riscv64-unknown-elf-gdb","miDebuggerServerAddress":"172.16.11.110:3333","miDebuggerArgs": "x ${workspaceFolder}/.vscode/gdbinit","svdFile": "/xxxxx/.vscode/peri.svd", #使用絕對地址"logging": {"exceptions": true,"moduleLoad": false,"programOutput": false,"engineLogging": false,"trace": false,"traceResponse": false,},},]}
其中name為顯示的名字
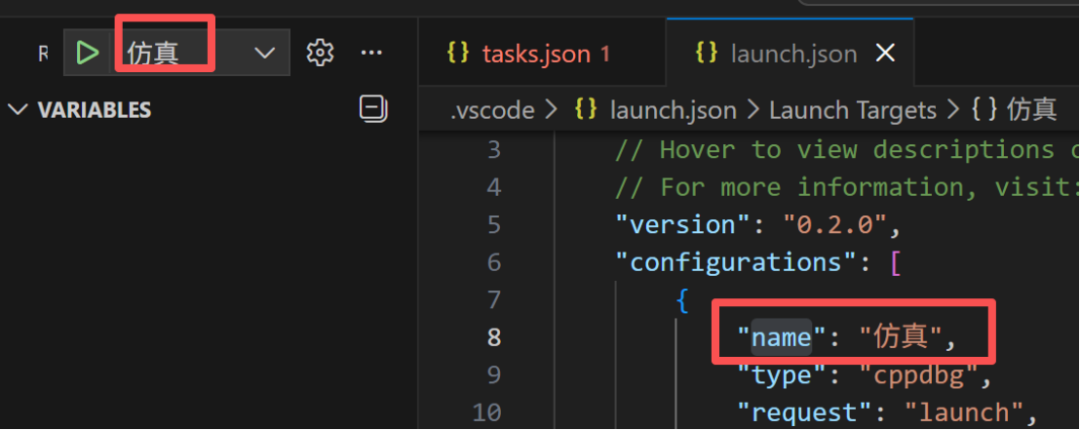
program指定要調試的程序比如elf文件
以下條目指定gdb程序
"miDebuggerPath": "riscv64-unknown-elf-gdb",
以下指定OpenOCD服務地址
"miDebuggerServerAddress":"172.16.11.110:3333",
指定仿真前進行編譯,編譯即前面task添加的編譯菜單。
"preLaunchTask": "編譯"
上述腳本等效于,打開gdb加載elf,然后連接openocd服務端。
riscv64-unknown-elf-gdb -f xxxx.elf
target remote 172.16.11.110:3333
Windows下運行openocd
.\openocd.exe -f .\xxx.cfg
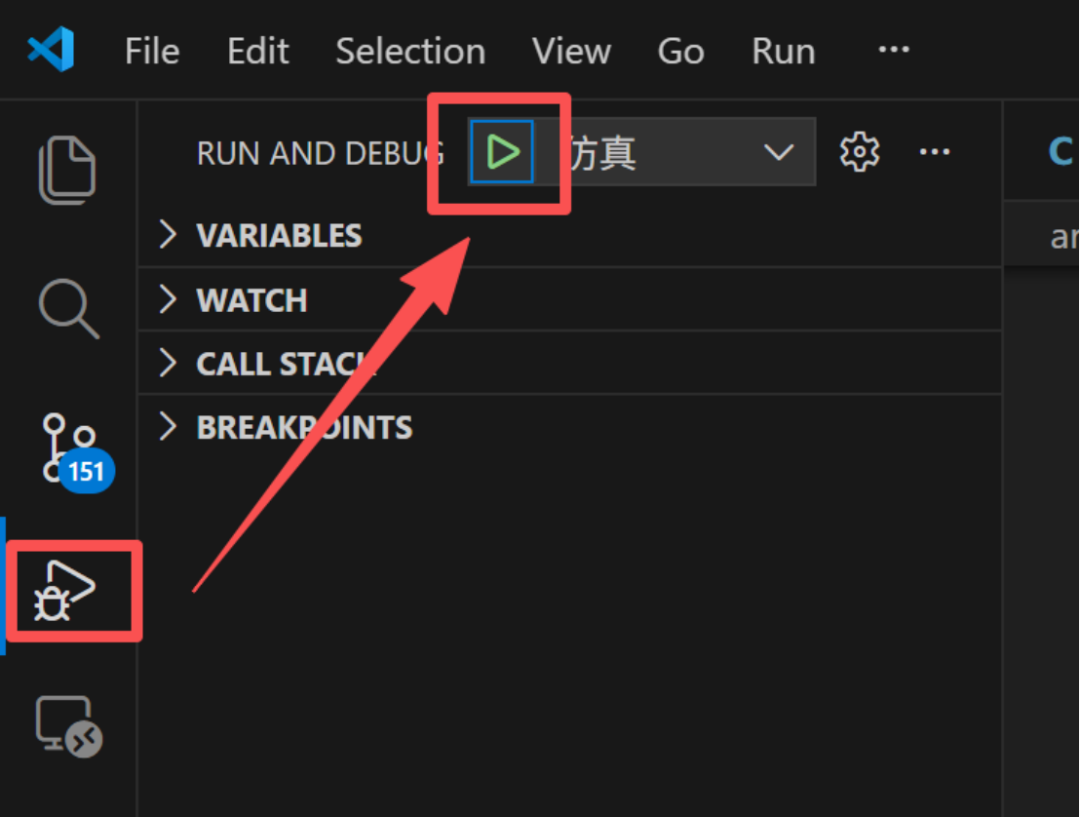
點擊如下添加的launch,連接OpenOCD,進入仿真環境
DEBUG CONSOLE的命令行中輸入
-exec 命令
比如
-exec load
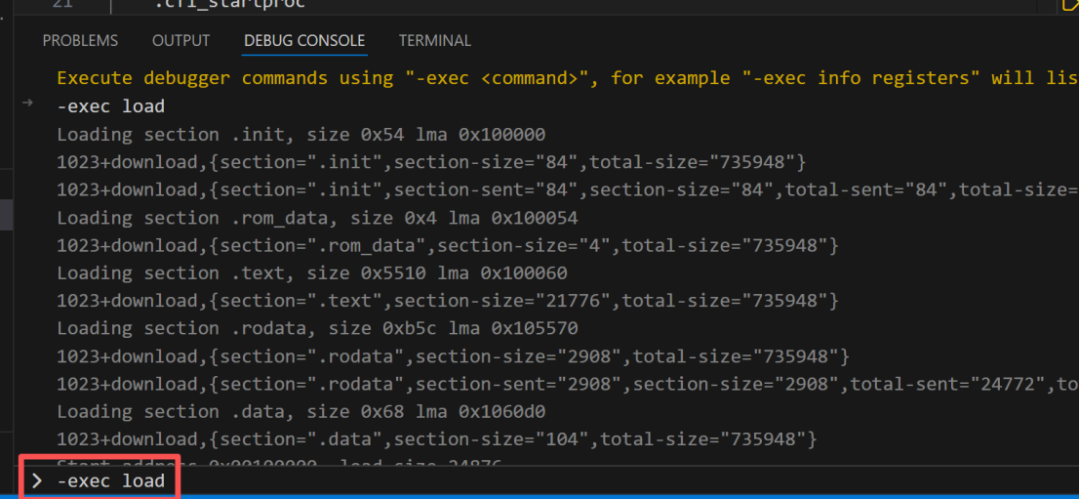
-exec后的內容透傳給GDB, 即相當于執行gdb的 load命令
這樣可以手動load程序。
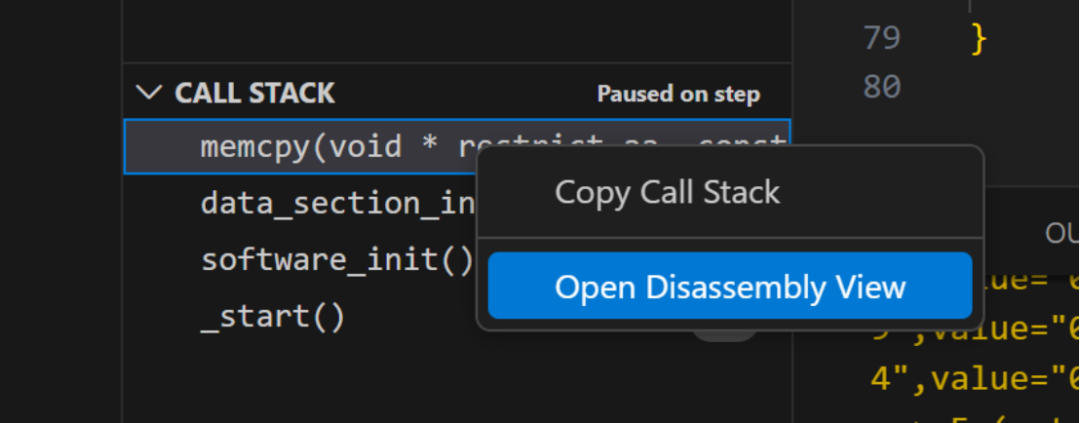
在左側CALL STACK中在函數上右鍵點擊, Open Disassemble View
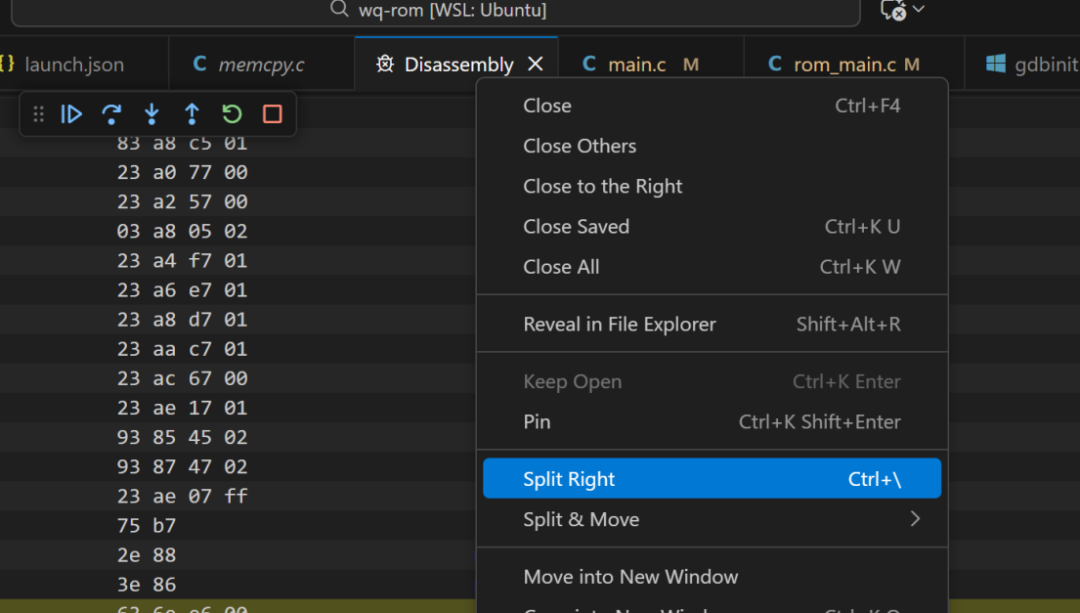
然后文件標簽上右鍵點擊Split Right
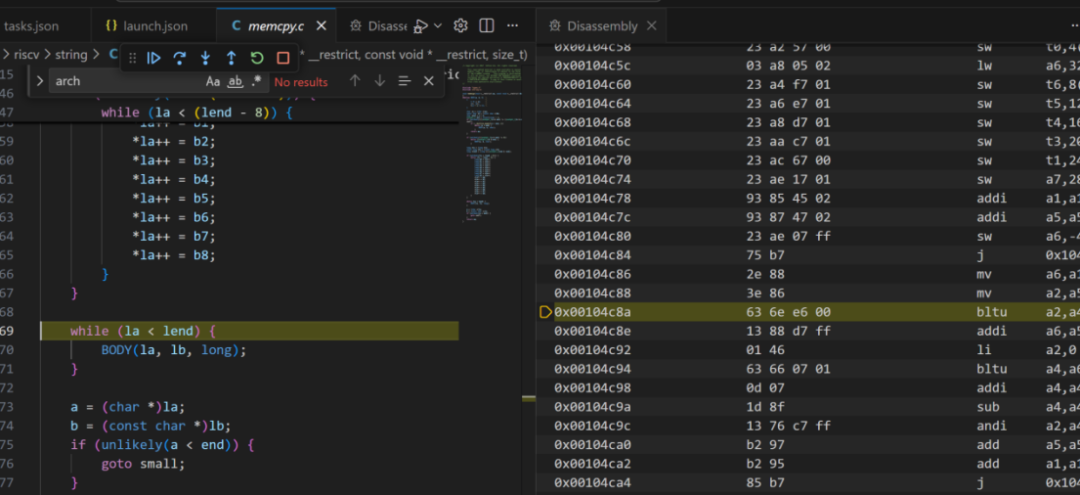
并列顯示源碼和匯編文件
此時可對照查看源碼和反匯編代碼
左側Run And Debug標簽下
VARIABLES下Registers->CPU
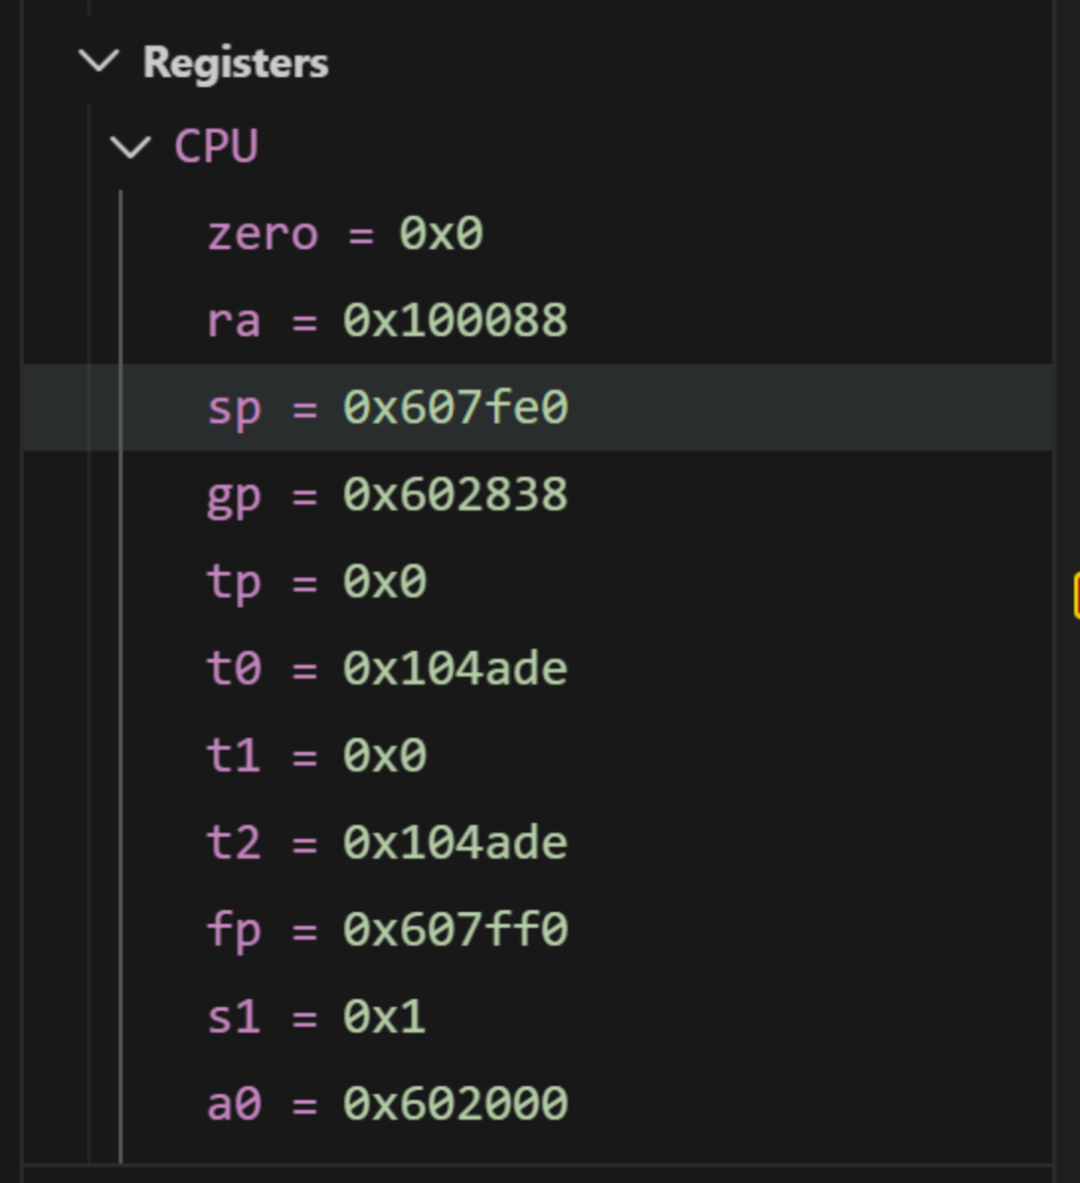
即GDB的i r看到的寄存器
左側Run And Debug標簽下
VARIABLES下Locals
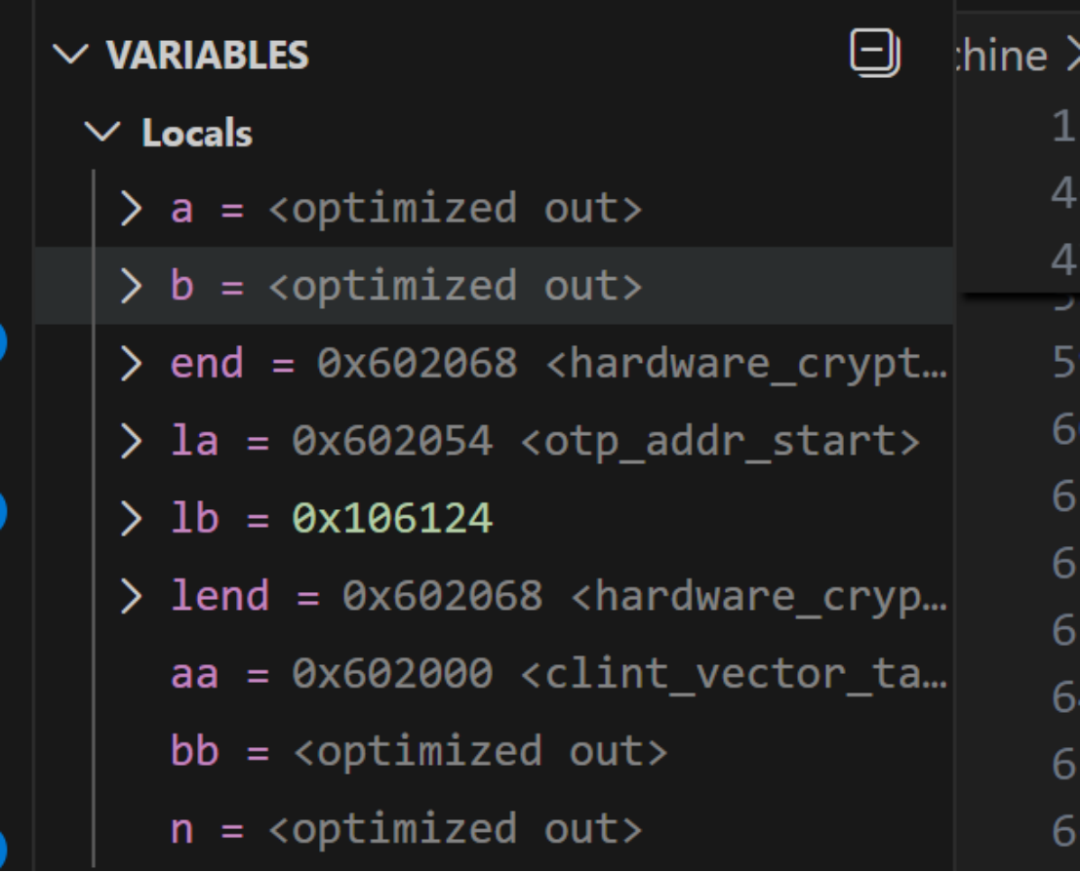
左側Run And Debug標簽下
WATCH下
點擊如下加號增加表達式
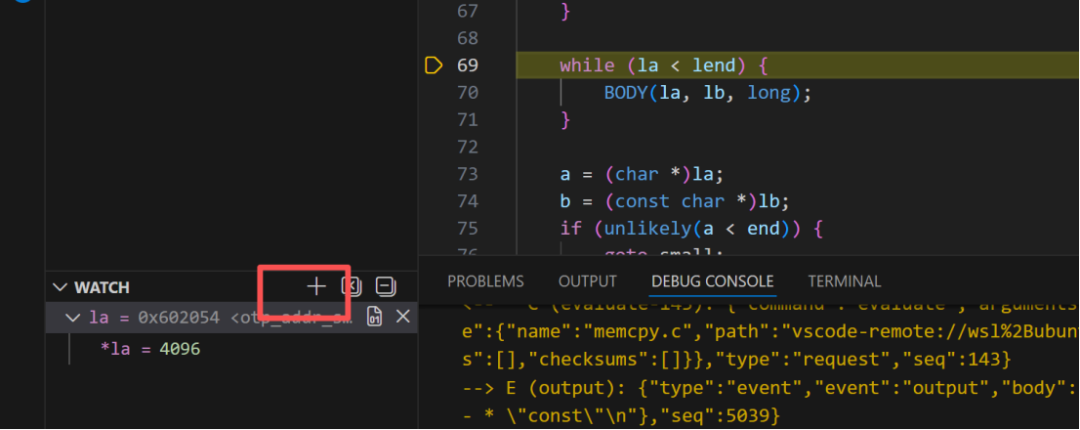
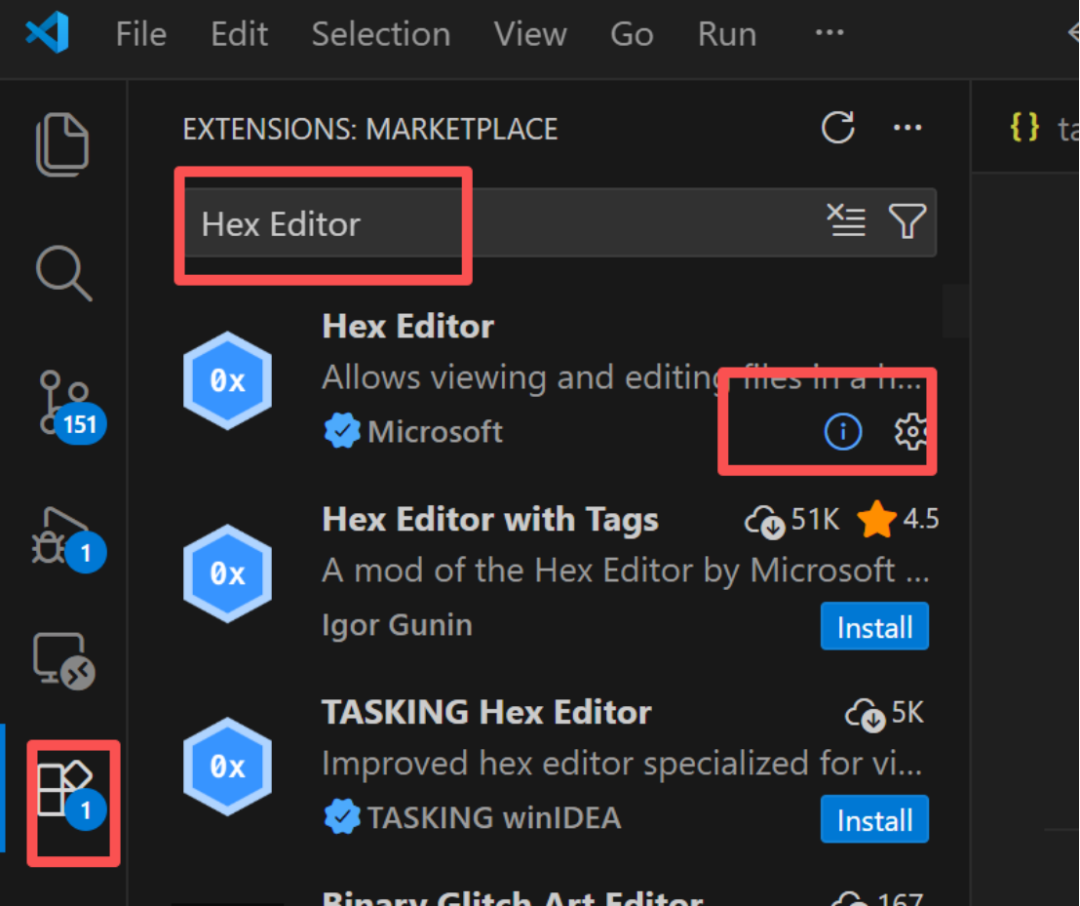
使用watch查看表達式值的二進制來實現, 因為watch查看二進制會生成一個bin文件,所以需要bin查看工具這里使用Hex Editor。
安裝插件
添加一個watch變量(使用指針變量,指向對應要查看的內存地址)
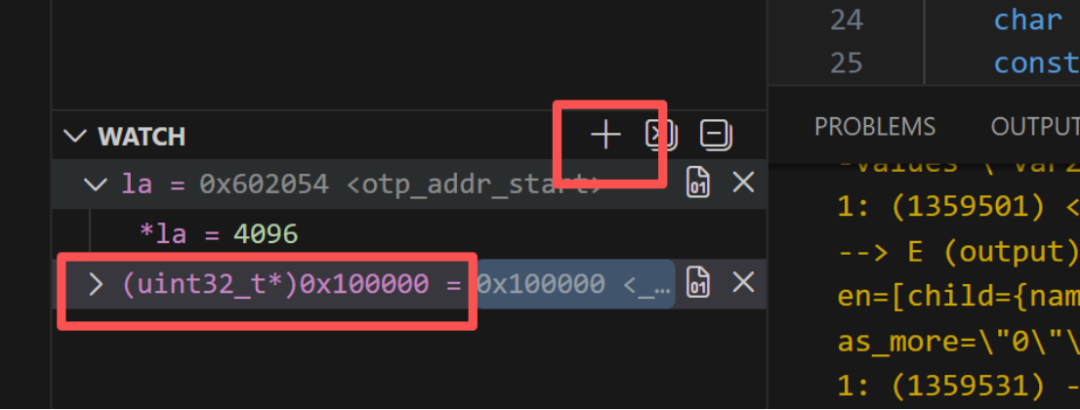
查看二進制
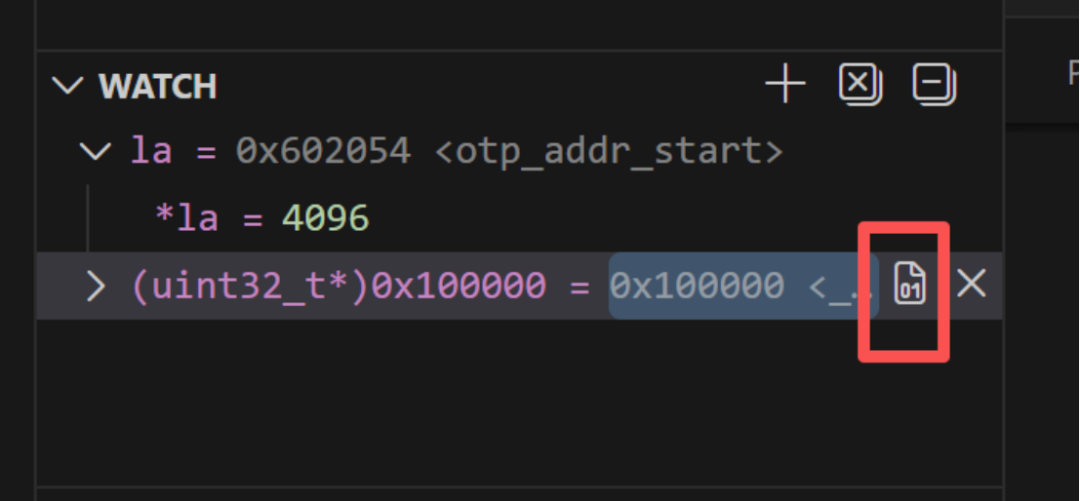
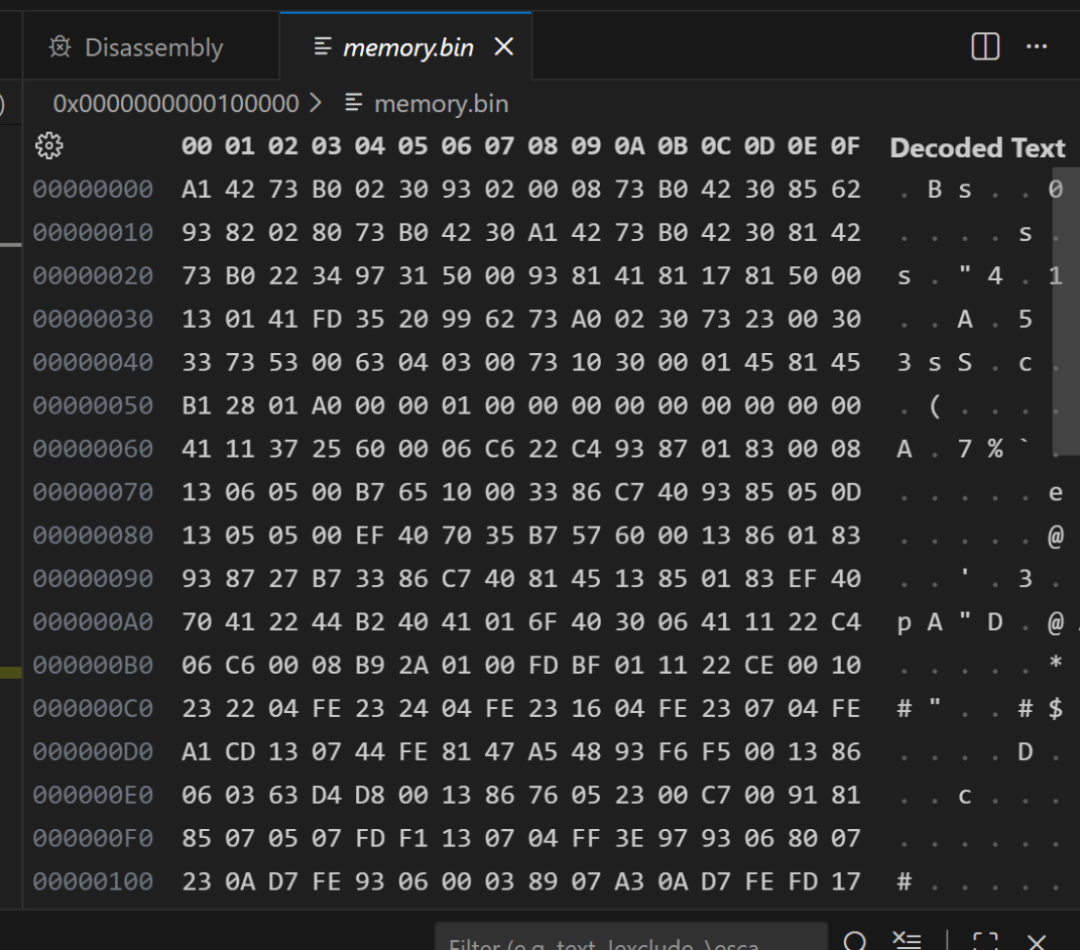
左側Run And Debug標簽下
BREAKPOINTS下
如下位置點擊+添加函數斷點
也可以直接代碼中左側點擊添加斷點
安裝插件Peripheral Viewer
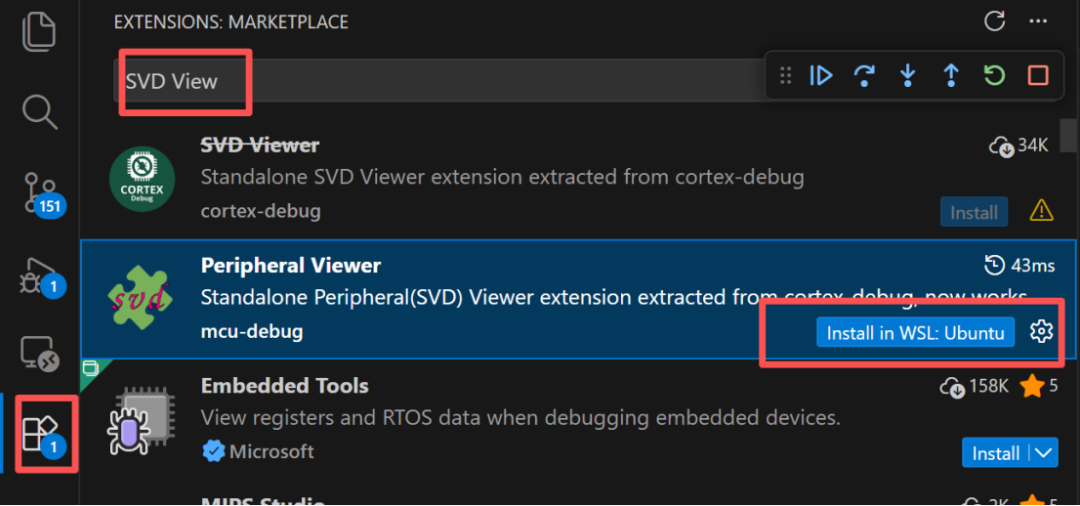
launch.json的configurations下添加
"svdFile":"${workspaceFolder}/.vscode/peri.svd",
.vscode/peri.svd內容廠商提供,如下是簡單的參考
<device><peripherals><!-- Timer 0 --><peripheral><name>TIMER0</name><version>1.0</version><description>32 Timer / Counter, counting up or down from different sources</description><groupName>TIMER</groupName><baseAddress>0x1300000</baseAddress><size>32</size><access>read-write</access><addressBlock><offset>0</offset><size>0x10000</size><usage>registers</usage></addressBlock><registers><!-- SR: Status Register --><register><name>SR</name><description>Status Register</description><addressOffset>0x04</addressOffset><size>16</size><access>read-write</access><resetValue>0x00000000</resetValue><resetMask>0xD701</resetMask></register></registers></peripheral></peripherals></device>
左側Run And Debug標簽下
可以看到XPERIPHERALS下對應的寄存器
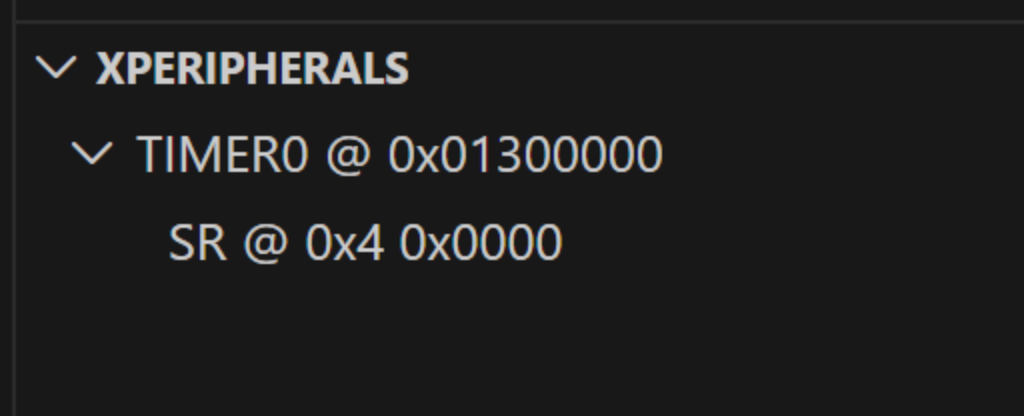
以上分享了基于Vscode和OpenOCD進行RISCV的硬件仿真調試, 主要優點是可視化交互適合新手,其實直接使用gdb的命令行更直接方便快捷。


